
Mayday, mayday! Is that how you feel when looking over JMeter? No worries. JMeter is a great tool for doing performance testing of web applications, but it may seem a tad bit tricky when looking it over for the first time.
LOAD TESTING
Load testing focuses on simulating and often exceeding your expected production load, throwing many concurrent requests at your site for an extended period of time. The key to load testing is realism. You need to know your application and your audience well so that you can balance your load across your application in a way that closely mimics your actual or expected production traffic.
While your load test is executing, you have the opportunity to monitor your entire server stack and see what happens over time as your application handles the load. As time progresses, the load should shift. This could be because more pages are being cached, or more keys are being invalidated. Your servers may be waiting on external services, or you could see swapping increase as your servers run out of physical memory. Load tests give you the opportunity to see how your application will perform when the going gets tough.
INSTALLING JMETER
JMeter provides a GUI for scripting tests, allowing you to create various elements in a tree to craft complex load tests that handle a wide variety of different scenarios. Installation is typically quite easy. On Mac, you can use Homebrew.
brew install jmeter
If you prefer, you can simply download the Java package and run it from wherever you like.
FIRE IT UP!
JMeter load tests are simply XML files so you can check them into your version control system without worrying about binary data.
To start JMeter, cd to your test plan folder and simply run jmeter.
CONFIGURATION
In order to make the configuration of our test plans easy to change, we set a number of user defined variables directly on the root element.
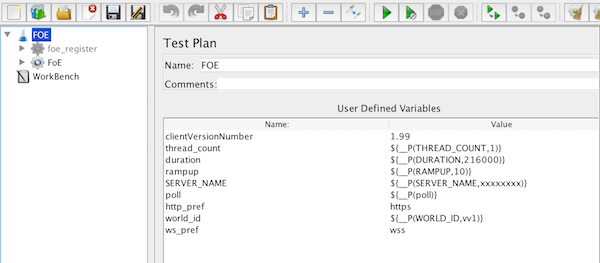
We do this so that we don’t have to go hunting in child elements to update these often-changed attributes.
The THREAD_COUNT setting determines how many virtual users will be accessing your application at the same time.
RAMPUP is a setting that allows you to slowly work your way up to the number of THREAD_COUNT. This way, your site is not immediately slammed by a large number of simultaneous connections all hitting the same URL, which is mostly unrealistic. The threads that began at the beginning of your test plan will have already progressed to some of the other URLs by the time new threads spin up, so it distributes the requests more evenly across your application.
We include these settings in our test plan elements with Java string substitution: ${my_variable_name}. The dollar sign and curly braces tell JMeter that it needs to read a variable or execute a function.
GENERATING REQUESTS
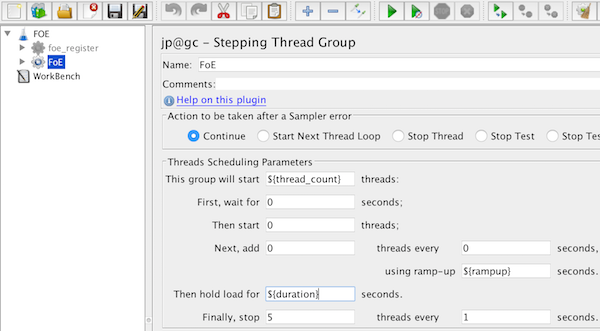
The first thing you’ll want to create in your test plan is a Thread Group. Right-click on the root element, select “Add”, then “Threads (Users)”, then select a Thread Group. Once the element is created, fill in the properties with your settings variables from the root element.
Next, right-click the thread group and select “Add → Sampler → HTTP Request”. The sampler element will be created, and you will be presented with a rather large variety of ways to customize your request. The only thing you need to pay attention to at the moment is “Server Name or IP” and “Path”.
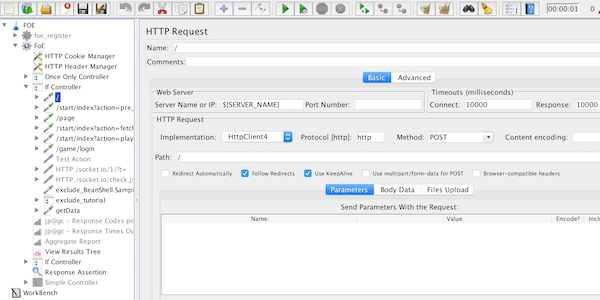
At this point, you can go ahead and run your load test. On Mac, the keyboard shortcut is Cmd+R. You can stop your test plan by pressing Cmd+.
GATHERING DATA
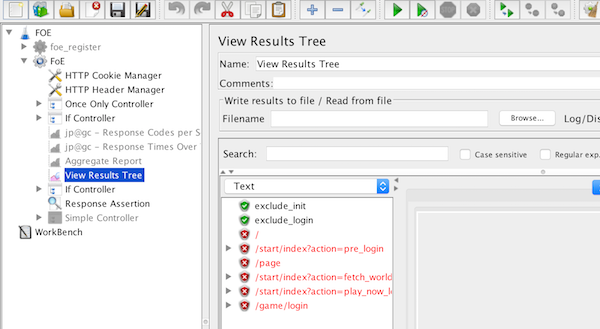
So your test can now make a request, but you won’t actually get any visible data back from it until you add a Listener. Two of the most useful Listeners are “Aggregate Report” and “View Results Tree”.
The results tree will give you the details of each request that JMeter generated. This is useful for tracking down errors in your plan, or in your application. After a test run the results tree can be cleared with Cmd+E.
The Aggregate Report gives you rolled up statistics, separated by sampler and then totalled at the bottom.
BOMBS AWAY!
You will typically want to run this kind of test targeting your staging environment, or if your application isn’t yet public you can aim it at your soon-to-be production setup. However, load testing from your local machine can be somewhat limiting because of bandwidth constraints.